Microsoft Power BI
- 4.5
- Rating
- 5.00M
- Installs
- Free
- Price

 Analysis by App-foxy
When I open Microsoft Power BI on a phone, I am not looking for a miniature replacement for a full desktop analytics setup. I use it for something more practical: checking whether the important numbers have changed and understanding what deserves attention before I sit down at a computer. That focus makes this business app surprisingly useful, especially for people who already work with Power BI reports and need their data close at hand.
The app is developed by Microsoft Corporation and is available free of charge for everyone. It belongs to the business category, has reached more than five million installs, and holds an average rating of 4.5 from roughly 75 thousand ratings. Those figures suggest a mature mobile companion rather than an experimental side project, but they do not tell the whole story. Its value depends heavily on whether your organization already uses Power BI and whether the reports you need have been prepared well for a small screen.
Why mobile report access matters more than another dashboard app
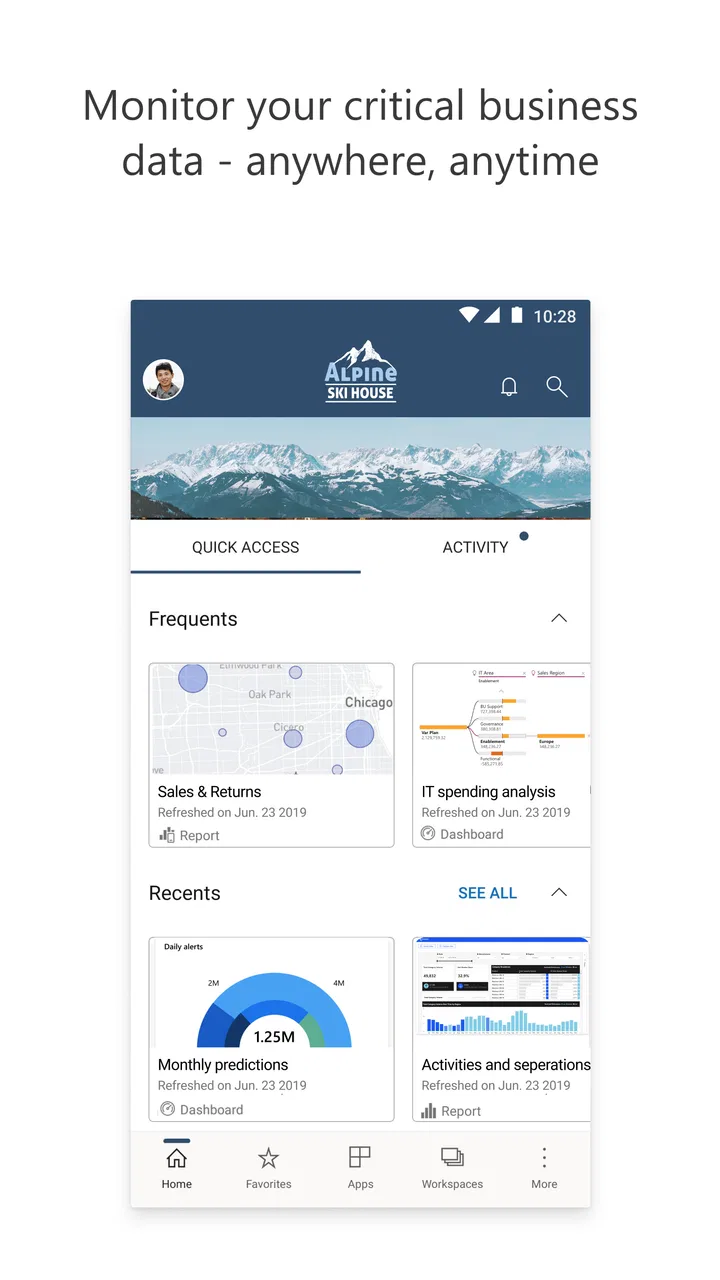
The capability I find most important is the ability to carry Power BI reports and dashboards into situations where opening a laptop would be inconvenient. A manager can review sales activity between meetings, a team lead can check operational figures from another location, and a project owner can look at a current view of progress without asking someone to export a screenshot first.
You May Also Like

 Blood Strike: 2.5 Anniversary
Blood Strike’s Loadouts Turn Every Drop Into a Tactical Gamble
A close look at Blood Strike’s custom loadouts: how fast access to signature weapons reshapes its battle royale rhythm, rewards preparation, and narrows the gap between fights.

 Pandora - Music & Podcasts
Pandora’s Music Is Easy to Start, but Harder to Recover
Pandora’s strength is its low-effort path from a seed to a station. Its weak spot is how much confidence it asks you to place in connection, setup, and quiet recovery.

 8 Ball Pool
 Is Built on Rivalries, Rematches, and Routine
A close look at the rivalries, rematches, shared routines, and unanswered safety questions that turn a quick pool match into a persistent mobile community.

 Samsung Music
’s Quiet Strength Is Playing What You Already Own
Its reach comes less from spectacle than from dependable access to a personal library. That simplicity is both the app’s strongest retention engine and its ceiling.

 AccuWeather: Weather Radar
AccuWeather Review: A Quick, Clear Forecast for Everyday Decisions
For everyday plans, the best forecast is the one you can understand quickly. AccuWeather makes rain timing, radar, and local conditions easy to act on, with a few trade-offs.

 Hill Climb Racing
Why Hill Climb Racing Still Turns Crashes Into One More Run
A tiny car, a bumpy hill and one more upgrade: Hill Climb Racing keeps resurfacing because its simple chaos makes every near-miss feel personal.
More From Our News Desk



That sounds simple, but the effect is bigger than convenience. A static spreadsheet or a message containing yesterday’s figures gives me a snapshot. A connected report gives me a place to investigate the number that looks unusual. I can move from a high-level visual toward the detail behind it, depending on how the report was designed. In practice, this changes the conversation from “Can you send me the latest file?” to “Why did this result move, and what should we do next?”
I would describe Power BI mobile as a viewing and decision-support tool first. It is not the app I would choose for building an entire reporting system from a phone. The strongest experience begins before the mobile session, when someone has already organized the data, selected useful visuals, and created a report that makes sense on a narrow display. The app then makes that work available at the moment it is needed.
That distinction is important for anyone comparing it with ordinary spreadsheet apps. A spreadsheet is often better when I need to enter values, change formulas, or make a quick one-off calculation. Power BI is more convincing when the data already exists in a structured reporting environment and I want to explore the result without manually rebuilding it.
What I actually do inside a report
My usual workflow starts with a quick scan. I look at the main cards, charts, or tables and ask whether the current result is normal. If something stands out, I interact with the report rather than treating the first screen as the final answer. Selecting a category, time period, or business area can narrow the view and help me see whether the change is broad or limited to one segment.
This is where a carefully designed report matters. A good mobile layout puts the decision-making information first and avoids forcing me to pinch, rotate, or scroll through a desktop canvas. When the report is crowded, the same interactive power becomes less helpful because I spend more time navigating than interpreting. My practical advice is to judge the report design separately from the app itself: Power BI can present a useful mobile experience, but it cannot rescue a confusing report.
I also find the drill-down style of investigation more useful than simply reading a headline figure. For example, if a total looks lower than expected, I want to narrow the view by region, product group, channel, or another available dimension. That kind of movement from summary to context is the app’s real advantage over a screenshot. It gives me a chance to form a better question before I contact the person responsible for the underlying numbers.
One less obvious benefit is that mobile review can expose poor reporting habits. If a dashboard only makes sense after a long verbal explanation, the phone makes that weakness obvious. Small labels, excessive visuals, and unclear filters are harder to ignore on a compact screen. I see that as useful feedback for report creators: a mobile audience encourages clearer priorities and simpler navigation.
A realistic day-to-day example
Imagine I am responsible for a regional sales team and have a meeting later in the morning. Before leaving, I open the relevant report and notice that the overall result is behind the expected direction. Instead of forwarding the headline to the team, I narrow the view to my region and then inspect the available breakdowns. The issue may be concentrated in one product group or one sales channel rather than affecting every representative.
That small investigation changes how I prepare. I can ask a more precise question in the meeting, focus on the part of the operation that needs attention, and avoid overreacting to a number that looked alarming only at the top level. The app does not make the decision for me. It gives me enough context to avoid making the decision from an incomplete snapshot.
This scenario also shows why the app is most useful when reports are refreshed and maintained by the organization behind them. The mobile interface can help me inspect what is available, but it does not turn stale or badly structured information into reliable analysis. I still need to know what each metric means, how current it is, and which filters are appropriate before acting on it.
Where it beats the usual alternatives
Compared with carrying a laptop, Power BI on a phone is faster for a brief check and easier to use during a conversation. I can look at the relevant report without opening a full work session. Compared with a spreadsheet attachment, it offers a more interactive way to move from a summary to the detail already prepared in the report. Compared with a screenshot, it is much better for asking “what is behind this number?”
However, the comparison changes when I need to create or repair analysis. A desktop browser or dedicated computer is usually the better choice for arranging a complex report, examining a large amount of information, or working through a detailed data problem. A spreadsheet remains more flexible for quick personal calculations and manual edits. Power BI mobile wins when the organization has already done the preparation and I need timely access to the result.
Another trade-off is consistency. A shared report can give a team one common view, which is helpful when everyone is discussing the same definitions. But that also means I am dependent on the report owner’s choices. If the selected measures do not answer my question, I may need to return to the desktop experience or ask for a revised report. The mobile app is powerful within its prepared environment, not a universal analytics toolbox.
Small-screen friction and the limits I notice
The first limitation is obvious after a few minutes: a phone has less room for labels, legends, filters, and tables. A report that feels comfortable on a monitor may become tiring on a mobile display. I prefer using the app for targeted questions rather than long analytical sessions. If I find myself repeatedly zooming or scrolling, I take that as a sign that the task belongs on a larger screen.
The second limitation is that mobile access can create false confidence. A polished visual is easy to read, but a readable chart is not automatically a complete explanation. I try to check the selected period and the active filters before drawing a conclusion. This is especially important when someone has shared a report built for a different team or business question.
The third limitation concerns workflow expectations. People sometimes install a business analytics app expecting to import any file, build a sophisticated dashboard, and finish the entire process from a phone. That is not the use case I would recommend. The app makes much more sense as part of a wider Power BI workflow where report preparation and governance happen elsewhere, while mobile access handles review and follow-up.
There is also a human trade-off. Easy access can encourage constant checking, even when the number has not changed enough to justify another decision. I get better results when I use the app at clear checkpoints: before a meeting, during a site visit, or when a specific question arises. Used that way, it reduces delays. Used as an endless stream of alerts in my head, it can become distracting.
Practical habits that improve the experience
I recommend starting with one report that supports a real decision instead of browsing everything available. A focused report is easier to understand on a phone and gives me a clear reason to open the app. Once I know which visual answers my recurring question, I can use the mobile experience quickly without wandering through unrelated pages.
Before trusting a result, I check three things: the time range, the filters, and the definition of the metric. This habit is more valuable than learning another gesture. A number may be correct while still being irrelevant to the question I am asking because the report is filtered to another region, period, or category.
I also avoid treating the first screen as a complete briefing. If the report supports deeper interaction, I use it to test whether the headline result remains true after narrowing the view. This is one of the most useful advanced habits I have found: use the mobile app not merely to consume a dashboard, but to challenge the first impression it creates.
For report creators, my advice is different. Test the report on a phone before expecting colleagues to rely on it away from a desk. Put the most important decision near the beginning, reduce visual competition, and make the filter logic understandable. The mobile audience will reveal whether the report communicates clearly or only looks impressive on a large monitor.
Who should install it, and who should skip it
I think the app is a strong choice for employees, managers, consultants, and business owners who already have access to Power BI reports and need to review them while moving between places. It is particularly suitable for people who make frequent decisions from summarized operational data rather than people who spend all day constructing models.
It can also help teams that want fewer manual updates. If the alternative is repeatedly exporting figures into messages or attachments, a shared report can give people a common reference point. The benefit is greatest when everyone understands the measures and the report is maintained as part of a regular business process.
I would skip it if I only need a personal budget sheet, a simple calculator, or a place to type and edit rows of data. In those cases, a spreadsheet app is likely to feel more direct. I would also choose a desktop environment when my main task is designing reports, investigating complicated data issues, or working for an extended period with dense tables.
Device compatibility is worth checking before installation. The listed minimum operating system is version 11, and the current version is 2.2.260811.21320514. The app is free, with an Everyone age rating, so the main question is less about purchase cost and more about whether the reports and access arrangements I need are already part of my work setup.
My closing view after using it as a mobile companion
Microsoft Power BI succeeds when I treat it as a way to bring prepared business insight into the moment a decision is being made. Its central strength is not that it replaces every other analytics tool. It is that a report can remain interactive after I leave my desk, allowing me to inspect a result instead of relying on a static export.
The experience is less convincing for editing, building, or prolonged analysis, and a poorly designed report can make the phone interface feel cramped. Those are real limits, not reasons to dismiss the app. They simply define the right role: quick investigation, shared context, and informed follow-up rather than complete report production.
My recommendation is straightforward. If your workplace already uses Power BI and you regularly need to answer “what changed?” while away from a computer, this free business app is worth trying. If you need a flexible personal workspace or a full desktop authoring environment, I would choose a different tool. The best reason to use it is the short path from a surprising number to a more useful question.
FAQs for Microsoft Power BI
01What is Microsoft Power BI, and what can I use it for?
Microsoft Power BI is a business intelligence and data visualization platform that turns information from spreadsheets, databases, cloud services, and other sources into interactive reports and dashboards. After reviewing the mobile experience, it is especially useful for monitoring key performance indicators, checking sales results, following operational metrics, and sharing insights while away from a desktop computer.
02Is Microsoft Power BI free to download and use?
The Microsoft Power BI mobile app can generally be downloaded at no cost, but access to reports and collaboration features depends on your organization’s Power BI licensing and workspace configuration. Many users need a Power BI Pro or Premium-based account to create, share, or access certain content. Before downloading, check whether your employer or school already provides the required license.
03Do I need a Microsoft account or company account to use Power BI?
Yes, Microsoft Power BI is designed around Microsoft account authentication. You will normally need a work, school, or organizational account connected to a Power BI environment to view shared dashboards and reports. A personal Microsoft account may not provide access to organizational content, so users should confirm their administrator has enabled Power BI and assigned the appropriate permissions.
04Can I use Microsoft Power BI without an internet connection?
Power BI is primarily an online service, so an internet connection is normally required to sign in, refresh data, and access the latest reports. Some previously loaded content may remain available temporarily through mobile caching, but offline functionality is limited and should not be treated as a full replacement for online access. Important decisions should be based on refreshed data.
05Is Microsoft Power BI suitable for beginners, and is my data secure?
Power BI can be approachable for viewing existing dashboards, although building professional reports requires time to learn data modeling, visual design, permissions, and formulas such as DAX. Security depends on how the organization configures its Microsoft environment. Features such as authentication, workspace permissions, row-level security, and encryption can help protect information, but administrators must configure them correctly.
Pros
- Interactive dashboards make complex data easier to understand.
- Connects with Excel
- SQL databases
- cloud services
- and many other sources.
- Real-time data updates help users monitor changing business metrics.
- Strong sharing and collaboration features support team decision-making.
- Mobile access lets you check reports and KPIs while away from your desk.
Cons
- Advanced features may require a paid Microsoft Fabric or Power BI license.
- The interface can feel overwhelming for first-time users.
- Large reports may load slowly on older phones or weaker connections.
- Some data sources require extra setup
- gateways
- or administrator permissions.
- Full report creation is more limited on mobile than on the desktop version.

Microsoft Power BI
Gallery